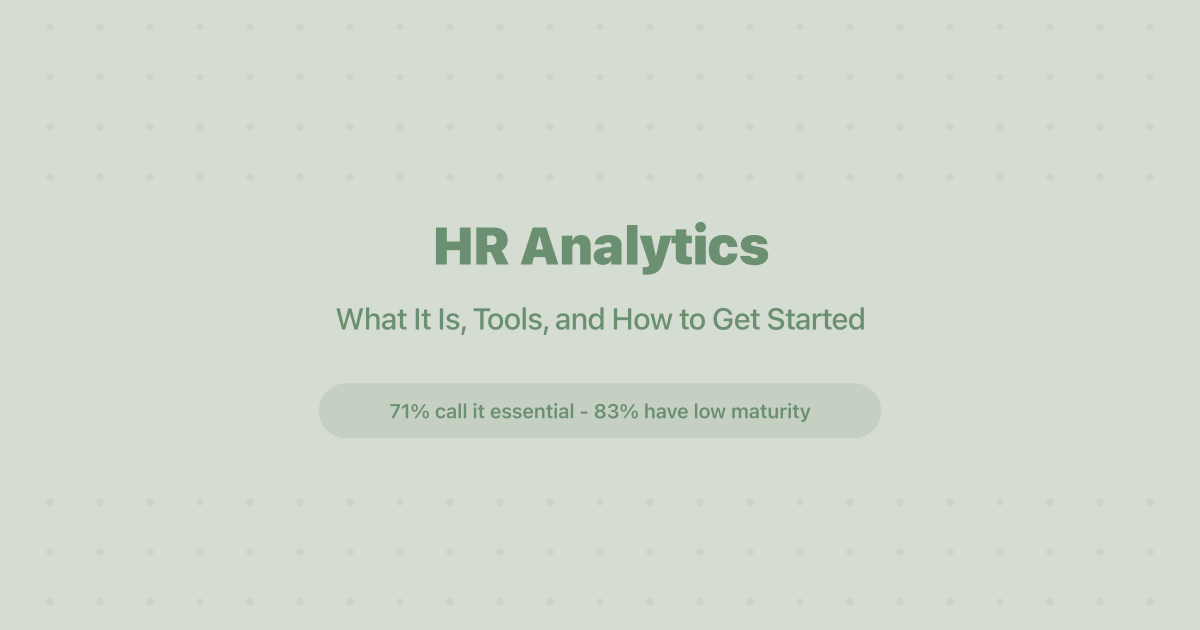
HR analytics is the practice of collecting, analyzing, and acting on workforce data to make better hiring and talent decisions. According to SHRM's people analytics research (2023), 71% of HR executives say analytics is essential to their strategy. Yet Deloitte research cited by AIHR shows that 83% of companies worldwide still report low workforce analytics maturity. That gap between intent and execution is where most teams get stuck.
This guide covers what people analytics actually looks like in practice, which metrics to track first, how to evaluate tools by team size, and a concrete 5-step framework for building an analytics program from scratch. Whether you're an HR generalist, a TA leader who's never built a dashboard, or a recruiting team trying to prove ROI on your hiring spend, you'll find a clear path forward here.
TL;DR: HR analytics turns workforce data into better hiring decisions. Despite 71% of HR leaders calling it essential (SHRM, 2023), 83% of organizations have low analytics maturity. Start with 3-4 core metrics, pick a tool that matches your team size, and build toward predictive capabilities over 6-12 months.
What Is HR Analytics?
HR analytics is the systematic use of workforce and candidate data to improve hiring, retention, and organizational decisions. 71% of HR executives say it's essential to their strategy (SHRM, 2023), yet only 9% of organizations plan their workforce strategically based on that data (McKinsey, 2025). Also called people analytics or workforce analytics, the field goes beyond tracking headcount or running a time-to-fill report. Done well, it connects data across the employee lifecycle: sourcing channels, interview outcomes, compensation patterns, engagement scores, and attrition trends.
The field operates at four distinct levels that build on each other:
- Descriptive answers "what happened?" - turnover was 18% last quarter, average time-to-hire was 42 days.
- Diagnostic answers "why did it happen?" - turnover spiked because new hires from one sourcing channel left at 3x the rate of others.
- Predictive answers "what will happen?" - based on engagement scores and tenure data, these 12 employees have a 70%+ probability of leaving within 6 months.
- Prescriptive answers "what should we do?" - to reduce Q3 attrition, adjust compensation for these roles, source replacements from channels with the highest 12-month retention.
Most organizations are stuck at the descriptive level. According to McKinsey's HR Monitor 2025, only 9% of HR leaders conduct strategic workforce planning with three-to-five-year time horizons - the remaining 73% focus entirely on short-term operational planning. That's the maturity gap this guide helps you close.
For recruiting teams specifically, people analytics narrows into talent analytics - the subset focused on acquisition data. Which sourcing channels produce hires who stay past 12 months? What's the real cost difference between a 30-day fill and a 60-day fill? Are interview scores predicting on-the-job performance? These questions separate data-informed teams from teams running on gut instinct. For a broader view of the talent function itself, see our guide to AI recruiting in 2026.
Why Does People Analytics Matter for Recruiting?
82% of organizations that use people analytics apply it to employee retention and turnover, while 71% apply it to recruitment and hiring, according to SHRM (2023). Those aren't abstract priorities. They're the two biggest cost centers in talent management - and the two areas where data has the most direct impact on outcomes.
The business case is straightforward. Recruiting without analytics means making million-dollar decisions on instinct. When the average cost-per-hire runs $4,700 for standard roles and over $10,000 for leadership positions (SHRM, 2025), knowing which sourcing channels, interview formats, and outreach sequences actually predict successful hires isn't optional. It's the difference between a hiring budget that compounds value and one that quietly burns cash.

The chart tells the story clearly. Nearly three-quarters of leaders call analytics essential. But only 39% have adopted AI in HR functions (SHRM State of AI in HR, 2026). Only 29% trust their data quality enough to act on it (SHRM, 2023). And just 9% are planning their workforce strategically (McKinsey, 2025). Each step down the chart represents a drop in organizational capability - and an opportunity for teams willing to close the gap.
The market reflects this demand. The analytics software market reached $3.69 billion in 2025 and is projected to grow to $6.13 billion by 2030 at a 10.8% CAGR, according to Research and Markets (March 2026). Talent acquisition and onboarding already account for 28.74% of that market - the largest application segment (Mordor Intelligence, 2026). Cloud-based deployment dominates, representing 75.67% of market revenue in 2025, and the fastest-growing segment is DEI analytics at a 14.83% CAGR. Organizations aren't just talking about data-driven HR. They're spending real money on it.
What makes the investment case even stronger: recruiting teams that track sourcing channel ROI systematically can redirect budget from low-performing channels to high-performing ones in real time. A team spending $50,000/year on job boards that produce only 15% of hires could reallocate half that budget to referral bonuses or AI sourcing tools that produce 40% of hires. That's not a theoretical exercise - it's the kind of reallocation analytics makes visible and defensible.
For the specific KPIs that recruiting teams should prioritize, see our breakdown of the 12 recruiter KPIs every hiring team should track.
The Four Levels of Analytics Maturity
Analytics maturity builds in four stages, and each level delivers value on its own. With 83% of companies reporting low analytics maturity (Deloitte via AIHR), most teams are at Level 1 or below. The mistake organizations make is trying to jump from spreadsheets to AI without building the foundational data practices first. Here's what each level looks like in practice.
Level 1: Descriptive - What Happened?
This is where most teams start, and that's entirely fine. Descriptive analytics tracks basic operational metrics: how many candidates applied, what was the time-to-fill for each role, which recruiters managed which requisitions. You're looking backward at completed events.
The tools here are straightforward. An ATS generates most descriptive reports automatically. The value comes from looking at the numbers consistently rather than only when something goes wrong. A team that reviews time-to-fill weekly catches bottlenecks three to four weeks earlier than one that only checks at quarter-end.
Level 2: Diagnostic - Why Did It Happen?
Diagnostic analytics digs beneath the surface numbers. Your time-to-fill jumped from 35 to 52 days last month - why? Was it a specific role type? Market conditions? A hiring manager who took two weeks to review resumes?
This level requires connecting data across systems. When you cross-reference ATS data with interview feedback, sourcing channel performance, and hiring manager response times, patterns emerge that raw numbers don't reveal. In typical diagnostic findings, referral candidates accept offers 30-40% faster than job board applicants, a single interview stage carries a 50-60% dropout rate, or time-to-fill runs 20 days shorter for roles where the hiring manager completed the intake meeting within 48 hours.
These insights don't require sophisticated tools - they require the right questions and joined datasets. A diagnostic practice is what separates a team that reports on hiring from a team that actually improves it.
Level 3: Predictive - What Will Happen?
Predictive analytics uses historical patterns to forecast future outcomes. Which current employees are most likely to leave in the next 6 months? How many hires will the sales team need in Q3 based on revenue projections and historical attrition? What's the probability that a candidate who scored highly in interviews will stay past 12 months?
This is where most teams stall. McKinsey's HR Monitor (2025) found that 93% of HR leaders document employee skills in their systems, but only 30% integrate that skills data into strategic workforce planning. The data exists. The predictive layer that turns it into forward-looking action usually doesn't.
Level 4: Prescriptive - What Should We Do?
Prescriptive analytics goes beyond prediction. It recommends specific actions. If a model predicts 15% attrition in engineering next quarter, prescriptive analytics identifies the specific interventions - compensation adjustments, role changes, workload redistribution - most likely to reduce that number, ranked by expected impact and cost.
Few organizations operate consistently at this level. But AI is making it more accessible. The SHRM State of AI in HR 2026 report found that 87% of HR professionals who use AI report efficiency improvements. And 92% of CHROs expect greater AI integration into their workforce by year-end 2026. The prescriptive layer is where that AI investment pays off most dramatically.
What is People Analytics? | AIHR Learning Bite
Which Metrics Should Every Analytics Program Track?
Not all metrics carry equal weight. These eight cover the core of what most recruiting and HR teams need - from operational efficiency to strategic outcomes. Start with the first four if you're building from scratch. Add the rest as your data infrastructure matures.
Operational Metrics (Start Here)
1. Time-to-fill. Days from job requisition to accepted offer. The industry median sits at 44 days (SHRM, 2025). Track this by role, department, and recruiter to spot bottlenecks. A team averaging 30 days that suddenly spikes to 50 has a process problem worth diagnosing before it becomes chronic.
2. Cost-per-hire. Total recruiting costs divided by number of hires. Include job board fees, recruiter salaries, tool subscriptions, and agency costs. The SHRM benchmark is $4,700 average. Knowing your number by source channel reveals where your budget works hardest - and where it doesn't.
3. Source-of-hire. Which channels produce actual hires, not just applications? In a common breakdown, job boards generate the majority of applications but a minority of actual hires, while employee referrals and targeted AI sourcing produce a disproportionate share of accepted offers. This metric directly affects where you invest sourcing resources next quarter. Track it at both the applicant level (who applied from where) and the hire level (who actually got hired from where) - the two numbers tell very different stories.
4. Offer acceptance rate. What percentage of extended offers get accepted? A dropping acceptance rate signals compensation misalignment, slow processes, or poor candidate experience - all diagnosable problems with specific fixes. Track the trend quarter-over-quarter rather than chasing a single benchmark number.
Strategic Metrics (Build Toward)
5. Quality of hire. The metric everyone agrees matters most but few organizations measure consistently. It typically combines hiring manager satisfaction at 90 and 180 days, new-hire performance ratings, and retention at the 12-month mark. Define your formula once, measure it every quarter, and watch how it correlates with sourcing channel and interview scores. For a deeper framework, see our guide to measuring quality of hire.
6. Turnover and attrition rate. Voluntary turnover by department, tenure band, and demographics. Your internal benchmarks matter more than national averages. A 10% turnover rate means nothing if your top performers are the ones leaving. Segment by tenure band (0-6 months, 6-12 months, 1-3 years, 3+ years) to identify whether you have an onboarding problem, a career development gap, or a compensation issue - each requires a different intervention.
7. Time-to-productivity. How long until a new hire reaches full performance? This varies dramatically by role - two weeks for retail, six months or more for enterprise sales. Tracking it reveals whether your onboarding process accelerates or delays impact. For more on connecting workforce data to hiring execution, see our guide to AI workforce planning.
8. Revenue per employee. Total revenue divided by headcount. It's a blunt metric, but when tracked quarterly, it shows whether hiring is actually growing capacity or just growing costs. A flat or declining ratio while headcount rises means new hires aren't contributing at the expected rate - a diagnostic trigger worth investigating.
People Analytics Tools: A Comparison for 2026
The right tool depends on your team size, budget, and analytics maturity. A 50-person company doesn't need the same platform as a 10,000-person enterprise. Here's how the current landscape breaks down, based on pricing data from vendor sites and analyst reports as of early 2026.
| Tool | Best For | Starting Price | Free Tier | Key Strength |
|---|---|---|---|---|
| Visier | Large enterprises (5,000+) | Custom ($50K+/yr) | No | Largest pre-built analytics library |
| ChartHop | Mid-market (200-2,000) | ~$12-25/employee/mo | No | Headcount + financial alignment |
| One Model | Data-heavy enterprises | Custom | No | Deepest technical flexibility |
| Crunchr | Mid-market teams | ~$12-25/employee/mo | No | Advanced data quality scanning |
| Orgnostic | SMBs (under 200) | $6-12/employee/mo | No | Story-like reports, fast setup |
| Knoetic | Small teams | Lower tier | Limited | Immediate visual dashboards |
Enterprise teams (5,000+ employees) typically need Visier or One Model. Visier has the broadest set of pre-built analytics models and acquired Yva.ai for real-time sentiment analysis through Slack and Teams. One Model is preferred by organizations with dedicated data teams who want deep technical control over their analytics stack. Both require custom pricing conversations starting well above $50,000 annually.
Mid-market teams (200-5,000 employees) get the most value from ChartHop or Crunchr. ChartHop stands out for tying headcount planning directly to financial models - useful when you need to show the CFO exactly what each hire costs and produces. It's particularly strong for organizations going through rapid headcount changes where financial alignment matters more than deep statistical analysis. Crunchr's data quality scanning catches inconsistencies before they corrupt your analytics, making it a better fit for organizations that suspect their data is messy but don't have a data engineer to clean it. Both typically price at $12-25 per employee per month.
Small teams (under 200 employees) should look at Orgnostic or Knoetic. Orgnostic generates narrative-style reports that non-technical stakeholders actually read, and it doesn't require a data team to implement. Knoetic provides immediate visual dashboards with minimal setup time.
One important distinction: these tools cover workforce analytics broadly - engagement, compensation, retention, headcount planning. For recruiting-specific analytics like sourcing channel effectiveness, outreach response rates, and interview-to-offer conversion, you need data from your ATS, CRM, or dedicated sourcing platform. Pin's recruiting analytics, for example, track sourcing effectiveness across 850M+ candidate profiles, showing which outreach sequences and candidate attributes convert at the highest rates - delivering a 48% response rate on automated outreach.
How Do You Get Started With People Analytics?
58% of organizations lack sufficient resources to upskill HR staff in data literacy, and 56% lack adequate data infrastructure for people analytics (SHRM, 2023). Those are the two biggest barriers to adoption. Consequently, the most effective approach isn't a full data transformation on day one - it's starting small and building momentum with early wins. Here's a 5-step framework that works around both barriers.
Step 1: Audit Your Existing Data (Week 1)
Before buying any tool, map what data you already have and where it lives. Your ATS has application volumes, time-to-fill, and source-of-hire. Your HRIS has headcount, tenure, compensation, and turnover. Your outreach platform has response rates and engagement data.
Most teams already have 70-80% of the data they need for Level 1 and Level 2 analytics - they just haven't connected it. Run a simple data quality check: pull 50 random records from your ATS and verify completeness. If more than 20% have missing fields (recruiter name, source channel, stage dates), fix the data hygiene problem before adding any analytics layer. Common culprits include recruiters who skip "source" dropdown fields, hiring managers who don't close requisitions promptly, and integration gaps between your ATS and HRIS. Remember - only 29% of organizations believe their data quality is high enough to act on reliably. Fixing the basics first prevents the "garbage in, garbage out" problem that kills analytics initiatives before they start.
Step 2: Pick 3-4 Core Metrics (Week 2)
Don't try to measure everything. Choose three or four metrics from the operational list above: time-to-fill, cost-per-hire, source-of-hire, and offer acceptance rate. These are available in almost every ATS without additional tooling, and they give you immediate diagnostic power.
Set a 90-day baseline. You can't improve what you haven't benchmarked. Pull reports for the last 90 days and record current performance. That baseline becomes the denominator for every improvement you measure going forward.
Step 3: Choose Your Tool (Weeks 3-4)
Match the tool to your maturity level, not your aspirations. If you're at Level 1 (descriptive), your ATS reporting plus a spreadsheet is sufficient for the first 6 months. If you're ready for Level 2 or 3, pick from the comparison table above based on team size and budget.
Ask three questions before buying anything: Does it integrate with my existing ATS and HRIS? Can non-technical users run reports without IT support? What's the implementation timeline? A tool that takes 6 months to configure won't deliver value for 9-12 months. Aim for time-to-value under 60 days.
Step 4: Build Your First Dashboard (Month 2)
Keep it to one page. Your first dashboard should show your 3-4 core metrics, trended over the last 90 days, broken down by department or recruiter. That's it. One page that answers: "Are we getting better or worse, and where?"
Share it weekly. Data only drives decisions when decision-makers see the numbers regularly. A monthly email with a PDF attached gets ignored. A weekly 5-minute review during the team standup changes behavior. When the VP of Talent sees that time-to-fill jumped 30% in one department, that becomes a conversation topic. When it's buried in a quarterly PDF nobody opened, it stays invisible.
Step 5: Move to Diagnostic, Then Predictive (Months 3-12)
Once your operational metrics are clean and consistently tracked, start asking diagnostic questions. Why did time-to-fill spike for engineering roles last month? Why do candidates from referrals convert at 2x the rate of job board applicants? What changed in Q2 that caused offer rejections to climb?
The answers to diagnostic questions reveal patterns. Those patterns become the inputs for predictive models. Within 6-12 months, a team that followed this sequence can predict hiring needs before requisitions open, forecast which new hires are likely to succeed, and allocate sourcing budget based on actual channel ROI rather than habit.
The progression matters. Teams that skip straight from no analytics to predictive models almost always fail - not because the technology doesn't work, but because they don't have clean data or organizational trust in the numbers. Build credibility at each level before advancing. When your descriptive and diagnostic analytics start influencing actual decisions (a manager changes their interview process, a recruiter shifts sourcing channels), you've earned the organizational trust to invest in prediction.
How Is AI Changing Workforce Analytics?
Only 9% of organizations currently use AI-driven people analytics, according to SHRM (2023). But that number is climbing fast. The SHRM State of AI in HR 2026 report found that 39% of organizations now have AI adopted in HR functions - a significant jump that puts 2025-2026 as the mainstream adoption tipping point.
What does AI actually change in practice? Three things that traditional analytics can't do at scale:
Pattern recognition across massive datasets. A spreadsheet works fine when you're analyzing 50 hires a quarter. However, when you're analyzing hundreds of thousands of candidate profiles to find patterns in who responds to outreach, who accepts offers, and who stays past 12 months, you need machine learning.
Pin is an AI recruiting platform with 850M+ candidate profiles, plans starting at $100/mo, and SOC 2 Type 2 certification. Its AI processes patterns across that database to surface which candidate attributes - skills combinations, career trajectories, company-size experience - predict the highest fit for specific roles. As a result, Pin delivers a 48% response rate on automated outreach and roughly a 70% candidate acceptance rate into hiring pipelines.
As Rich Rosen, Executive Recruiter at Cornerstone Search, describes the impact: "Absolutely money maker for recruiters... in 6 months I can directly attribute over $250K in revenue to Pin."
Continuous learning. Traditional dashboards are static snapshots. AI-powered analytics improve as they process more data. Every successful hire, every rejected candidate, every outreach sequence that gets a response feeds back into the model. Six months of use produces dramatically better predictions than month one.
Proactive alerts instead of reactive reports. Instead of discovering that attrition spiked last quarter, AI flags the warning signals two months before people leave. Instead of realizing you need engineers after the requisition opens, AI projects the gap based on project timelines and historical patterns. The shift from backward-looking reports to forward-looking intelligence is the fundamental difference AI brings to workforce data. And it compounds: a team that catches a retention risk early spends 20% of what it would cost to backfill the role after the person leaves.
92% of CHROs expect greater AI integration into their workforce by year-end 2026 (SHRM, 2026). That's not aspirational - it's a planning assumption. Teams that wait another year to adopt AI-powered analytics will find themselves competing for talent against organizations that already have 12+ months of model training and pattern data built up.
The barrier is measurement. 56% of organizations don't formally measure their AI investment's success in HR (SHRM, 2026). If you can't measure ROI on AI tools, you can't justify expanding them. Start by tracking time-to-fill and quality-of-hire before and after AI adoption. That before/after comparison is the simplest proof of value.
Pin's AI scans 850M+ profiles to match candidates with recruiter-defined criteria - see how data-driven sourcing works.
HR Analytics and How to Get Started
Key Takeaways
- Start where you are. Most teams already have 70-80% of the data they need for basic analytics. The first step is connecting it, not buying more tools.
- Track 3-4 metrics first. Time-to-fill, cost-per-hire, source-of-hire, and offer acceptance rate give you diagnostic power without a data science team.
- Match your tool to your maturity. Enterprise teams need Visier or One Model. Mid-market teams should evaluate ChartHop or Crunchr. Small teams can start with Orgnostic or their existing ATS reports.
- Build toward predictive. The 5-step framework moves you from descriptive analytics (what happened) to predictive analytics (what will happen) within 6-12 months of consistent practice.
- AI is the multiplier. Only 9% of organizations use AI-driven analytics today, but 92% of CHROs expect greater AI integration by year-end 2026. Early adopters compound their advantage over time.
Track your recruiting analytics with Pin's AI-powered sourcing →
Frequently Asked Questions
What is the difference between HR analytics and people analytics?
The terms are frequently used interchangeably in practice. People analytics typically covers the full employee lifecycle from hiring through retention and exit. The HR version is a slightly broader umbrella that can also include workforce planning, compensation analysis, and organizational design. For recruiting teams, the relevant subset is talent analytics - focused on acquisition data like sourcing effectiveness, interview conversion rates, and quality of hire. See our guide to talent acquisition for the broader context.
How much does people analytics software cost?
Pricing ranges dramatically by team size. Enterprise platforms like Visier start above $50,000/year with custom pricing. Mid-market tools like ChartHop and Crunchr typically cost $12-25 per employee per month. SMB options like Orgnostic run $6-12 per employee per month. Many ATS platforms include basic reporting at no additional cost. The global analytics software market reached $3.69 billion in 2025 and is growing at 10.8% annually (Research and Markets, 2026).
What metrics should I track first in an analytics program?
Start with four operational metrics: time-to-fill, cost-per-hire, source-of-hire, and offer acceptance rate. These are available in nearly every ATS, require no additional tooling, and provide immediate diagnostic value. Once those are stable and consistent, add quality-of-hire and turnover rate. SHRM's 2025 benchmarks put median time-to-fill at 44 days and average cost-per-hire at $4,700 - use those as initial comparison points against your own numbers.
How long does it take to implement a people analytics program?
A basic descriptive analytics practice can launch in two to four weeks using existing ATS data. Implementing a dedicated analytics platform typically takes 30-90 days depending on integration complexity and data quality. Moving from descriptive to predictive analytics usually requires 6-12 months of consistent data collection and process refinement. The biggest time sink isn't the technology - it's cleaning data and building the organizational habit of data-informed decision-making.
Can small teams benefit from workforce analytics?
Yes, and they often benefit the most because every hiring decision carries more weight. When you're making 20 hires a year instead of 2,000, a bad hire costs proportionally more. Tools like Orgnostic and Knoetic are built for smaller organizations, and basic analytics through your ATS is free. The key is consistency: track the same 3-4 metrics every week and review trends monthly. Small teams that do this outperform larger teams that have dashboards but don't look at them.