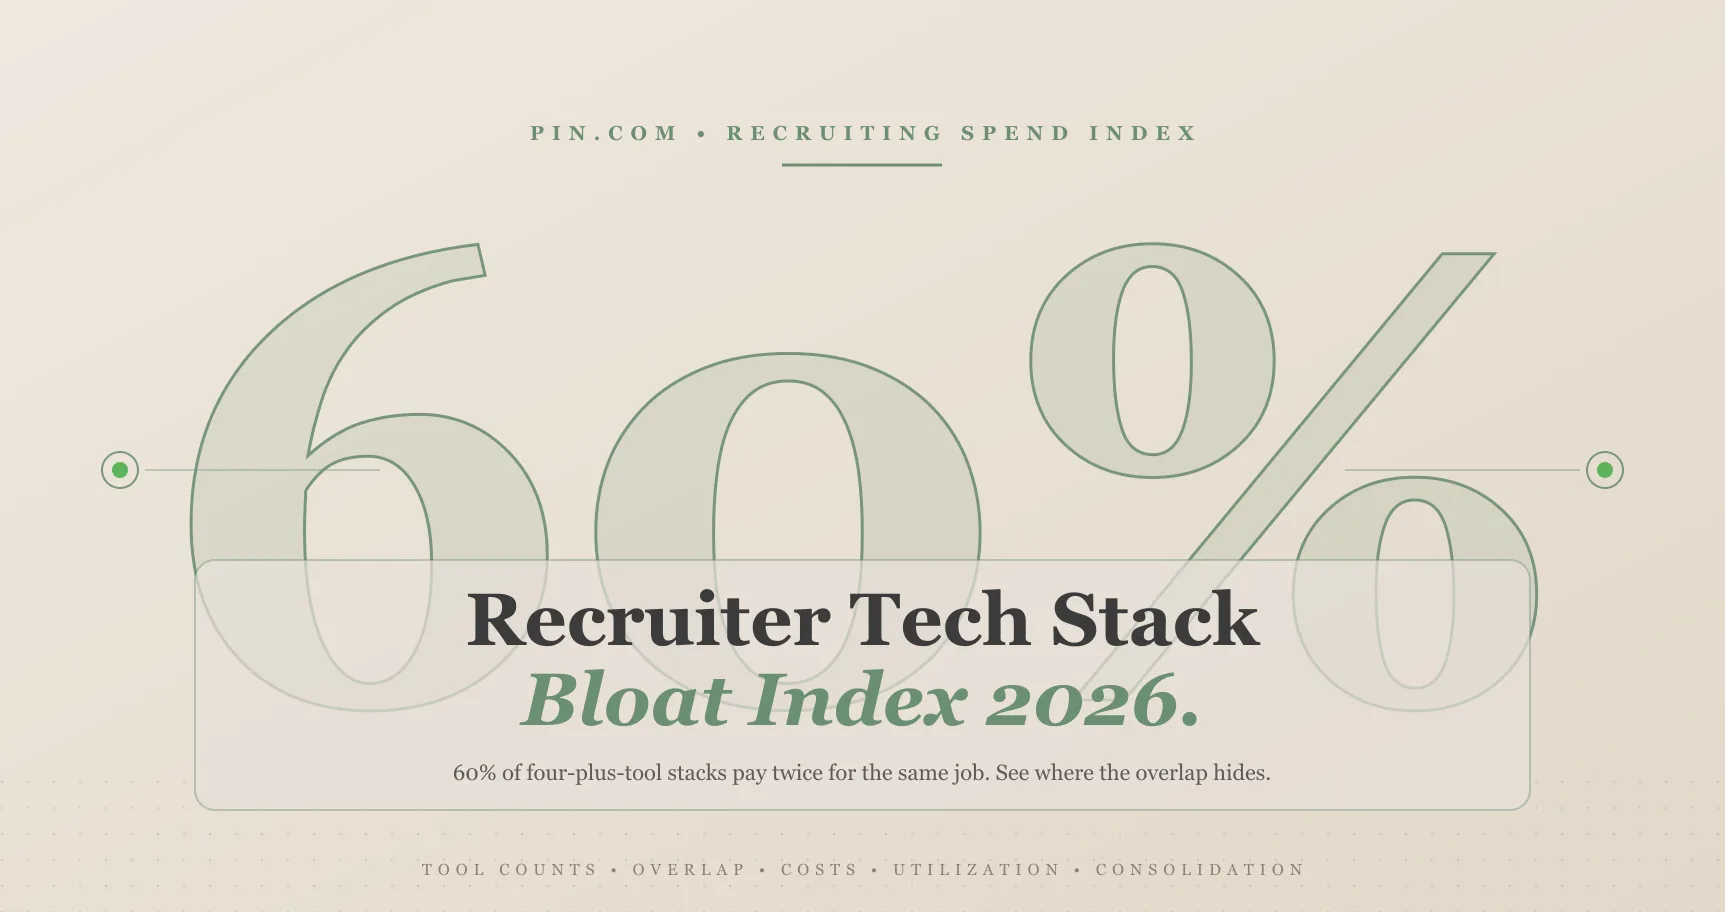
The average recruiter tech stack in 2026 holds 1.8 paid recruiting tools that teams name unprompted. Pin built this first Recruiter Tech Stack Bloat Index from discovery conversations with more than a thousand recruiting teams between April and October 2026, and the waste piles up at the top end. Among teams paying for four or more tools, 60% pay twice for the same job. Public license data tells the same story from the other side. Zylo’s 2026 SaaS Management Index puts unused licenses at 36% of the average company’s seats. Vertice clocked SaaS price inflation at 16.4% in June 2026, while LinkedIn Recruiter Corporate seats list at $8,000 to $12,000 a year whether a recruiter logs in daily or monthly.
Those counts cover search, contact data, outreach, job ads, AI assistants, and any ATS or CRM a team mentioned, so they’re a floor rather than a full inventory. So the problem isn’t that recruiters own 30 tools, since most own two or three. The problem is that the second and third subscriptions duplicate functionality the first already provides, and renewals arrive faster than anyone audits them.
Bottom line:
- Most stacks are small. 51% of teams named one paid recruiting tool, 30% named two, and 20% named three or more.
- Overlap grows with every tool. 20% of two-tool stacks duplicate a layer. That rises to 33% at three tools, 52% at four, and 80% at five or more (60% across all stacks of four-plus).
- Search is where teams double-pay. 62% of teams run LinkedIn Recruiter, and 18% of those also pay for a separate contact-data tool to get the emails Recruiter doesn’t provide.
- Dissatisfaction is the norm. 65% of teams spoke negatively about at least one tool they currently pay for, and 37% had already dropped one.
- Consolidation is the fix. Pin users report a 90% reduction in overall recruiting spend, and 91% reduced or eliminated LinkedIn Recruiter spend (Pin 2026 user survey).
How Many Tools Does the Average Recruiter Pay For?
Half of all recruiting teams name exactly one paid recruiting tool, and the long tail is thin. Across the teams in the index, the average was 1.8 paid recruiter tools, the median was one, and only 6.3% named four or more.
Those counts represent a conservative floor, because they capture the tools a team volunteered during a single conversation about sourcing and outreach. As a result, the ATS is mostly missing and so are job-ad budgets that marketing owns. A 2025 survey of 930 North American recruiting professionals, reported by UNLEASH, found most teams now run five or fewer tools in total, with one line worth remembering: teams aren’t spending less, they’re toggling less. The same study surfaced two numbers that explain why count alone misleads. One in five respondents spend up to 80% of their tech budget on a single source, and 84% of teams say their primary sourcing tool delivers less than 40% of their hires. Concentrated spend on an underperforming anchor tool is exactly the condition that breeds add-ons.
Candidate search dominates the categories those tools cover:
- Candidate search (80%). LinkedIn Recruiter, Sales Navigator, or an AI sourcing tool. LinkedIn Recruiter alone shows up in 62% of stacks.
- Contact data (20%). Email and phone lookup tools such as ZoomInfo, Apollo, and Lusha.
- Job ads (18%). Indeed, ZipRecruiter, and niche boards.
- ATS or recruiting CRM (14%). Heavily undercounted, since few teams mention the system of record unprompted.
- Outreach sequencers (9%). Standalone email and LinkedIn cadence tools.
- General AI assistants (6%). ChatGPT and Claude team plans used for drafting outreach and job descriptions.
For a broader census that includes ATS market share and satisfaction scores, see what 2,000+ TA teams report running. This index narrows the lens to one question: how much of what recruiters pay for overlaps?
What Do Recruiters Say About Their Stacks?
We’ve noticed that bloat rarely comes from a bad purchase; it starts with a good one. A tool solves 70% of a problem, and a second purchase covers the other 30%. The most common version we hear starts with a team buying LinkedIn Recruiter for search and discovering it doesn’t hand over email addresses or phone numbers. Next comes a contact-data tool, then a sequencer, because neither product sends multi-step campaigns. The result is three invoices supporting one workflow. Agency owners describe paying for “the Cadillac version” of LinkedIn mostly for InMail credits, while in-house leads admit they aren’t using every Recruiter seat they pay for. Almost nobody describes their stack as a deliberate plan; they describe an accumulation of renewals. That’s why the overlap numbers below climb so steeply: each new tool gets bought to fix a gap, and the old tool keeps billing anyway.
Does Overlap Rise With Every Tool Added?
Yes: overlap climbs from 20% of two-tool stacks to 80% of five-tool stacks, so recruiting software spend doesn’t scale with value. Each added tool raises the odds that two products do the same job. We define overlap as a team paying for two or more tools in the same layer: two search products, two contact-data providers, two sequencers, or two systems of record. Job boards are excluded, since multiple boards reach different candidate pools on purpose.
While the chart measures how many teams overlap, the Bloat Index itself measures how much of each stack is duplicate: the share of a team’s paid tools that repeat a layer it already covers. That benchmark sits at 10% for two-tool stacks, 11.5% at three, 16% at four, and 24% at five or more. Put plainly, roughly one in every four tools a five-tool team pays for is redundant.
Candidate search is the worst offender: among teams that pay for LinkedIn Recruiter, 18% also pay for a separate contact-data provider and 12% pay for a second sourcing product on top. Those aren’t fringe configurations; they’re the default path when the first tool finds candidates but can’t reach them.
How Much Does the Average Recruiter Tech Stack Cost?
A single recruiter running the common LinkedIn-plus-data stack spends about $11,000 a year at list prices before the ATS, job ads, or a shared ZoomInfo contract. Here are the published or reported prices we checked in October 2026:
| Tool | Published or reported price | Billing | Source |
|---|---|---|---|
| Pin | Free plan; Solo $99/mo; Professional $135/user/mo | Annual (Professional also $179 monthly) | Pin pricing page |
| LinkedIn Recruiter Lite | $1,680 per seat per year | Annual or ~$170 monthly | LinkedIn Help |
| LinkedIn Recruiter Corporate | $8,000-$12,000 per seat per year | Quote only, annual | Vendr, 2026 |
| ZoomInfo | $33,500 median annual contract | Annual, quote only | Vendr, 2026 |
| Lusha Pro | $52.45 per user per month | Annual | Lusha |
| Claude Team (standard seat) | $20 per user per month | Annual | Anthropic |
The illustrative math for one recruiter on a Corporate seat looks like this: $10,000 for LinkedIn Recruiter at the midpoint, $629 for a Lusha Pro seat, and $240 for an AI assistant. That’s $10,869 a year, and it still doesn’t send a multi-step sequence or book an interview. Swap in a team-wide data contract and the number jumps fast, since a median ZoomInfo deal runs $33,500, in line with ZoomInfo’s annual contract math we’ve tracked through 2026. For the full seat-by-seat view of the biggest line item, read the complete LinkedIn Recruiter cost breakdown.
Subscription prices also keep rising underneath the stack. Vertice’s SaaS Inflation Index hit 16.4% in June 2026, its highest monthly reading, up from 13.2% in Q1. An unused seat bought in 2025 costs more to keep in 2026, even if nobody touches it.
How Much of Your Recruiting Software Do You Actually Use?
About two-thirds of it, if recruiting matches the wider SaaS market, where 36% of licenses go unused. Usage trails spend across every category of business software, and recruiting is no exception. Pin can’t see login data inside other vendors’ products, so the utilization side of the index comes from the license-management firms that can:
- 36% of SaaS licenses go unused at the average organization, measured against recommended utilization (Zylo 2026 SaaS Management Index, 40M+ licenses analyzed).
- The average company manages 305 SaaS applications, and business units, not IT, control 81% of SaaS spend (same Zylo report). Recruiting tools usually sit in that 81%.
- 43% of IT asset managers report rising wasted SaaS spend year over year, and 59% report rising waste on AI software (Flexera 2026 State of ITAM).
- 88% of HR leaders say their organizations haven’t realized significant business value from AI tools (Gartner, October 2025).
Pin’s conversations add the sentiment layer. 65% of teams spoke negatively about at least one tool they currently pay for. LinkedIn Recruiter drew the sharpest split: among teams currently paying for it, 36% of their comments were negative and only 6% were positive. Cost, missing contact data, and InMail limits came up most. When a team keeps paying for a product it openly dislikes, the renewal is running on inertia, not value.
Heavier workloads make underutilization worse. Half of the recruiters in Pin’s recruiter capacity research carry six or more open roles, and LinkedIn’s January 2026 research found 42% are being asked to fill roles faster (HR Dive). A recruiter juggling that many requisitions opens the one or two tools that move candidates forward, while the rest sit idle until renewal.
Seat utilization is the metric most TA leaders never see. Finance sees the invoice, IT sees the SSO login (if the tool is behind SSO at all), and the recruiter sees the workflow. Nobody owns the question of whether a $10,000 seat produced any hires last quarter. That ownership gap, not any single bad vendor, is what lets a stack drift from deliberate to bloated. HR Leaders Network’s session on adoption covers the same problem from the HR systems side: why teams buy software that employees then route around.
How to Build an HR Tech Stack Employees Actually Use
Frequently Asked Questions
What is a recruiter tech stack?
A recruiter tech stack is the set of paid software a recruiter uses to find, contact, track, and hire candidates. It usually includes an ATS or recruiting CRM, a candidate search tool such as LinkedIn Recruiter, a contact-data provider, an outreach sequencer, and job boards. In Pin’s 2026 index, teams named 1.8 paid recruiting tools on average.
How many tools does a recruiter need?
Most recruiters need two: a system of record (ATS or CRM) and one platform that covers search, contact lookup, and outreach together. Overlap starts once teams add separate products for each of those jobs. In Pin’s data, 52% of four-tool stacks already pay twice for the same layer.
How much does recruiting software cost per recruiter?
A LinkedIn Recruiter Corporate seat plus a contact-data tool and an AI assistant runs about $11,000 per recruiter per year at list prices, before the ATS and job ads. Recruiter Lite brings the search line down to $1,680 a year. An all-in-one platform like Pin starts with a free plan, and paid plans begin at $99 a month billed annually.
How do you reduce recruiting software spend?
Start by mapping every paid tool to the job it does, then cancel duplicates in the same layer at their next renewal. Search and contact data are the most common overlaps. Teams that consolidate onto one sourcing-and-outreach platform cut the most: 91% of Pin users reduced or eliminated LinkedIn Recruiter spend after switching.
What Are the Hidden Costs of a Bloated Stack?
The biggest hidden costs are app toggling, shadow AI purchases, and auto-renewals. The invoice is the visible cost of bloat, but the time cost is bigger. An HBR study of 137 workers at three Fortune 500 companies found people toggled between apps and websites nearly 1,200 times a day. Those switches cost just under four hours a week in reorientation, about five working weeks a year. A recruiter who copies a profile from one tool, looks up an email in a second, and pastes it into a third is paying that toggle tax on every candidate.
Shadow purchasing conceals additional spend: Zylo found expense-based SaaS spend rose 267% year over year and ChatGPT is now the single most-expensed application. Recruiters buying AI notetakers, enrichment credits, or sequencers on a corporate card won’t show up in IT’s inventory, which is why Flexera found only 31% of organizations have full visibility into their AI software.
Auto-renewals then lock everything in place.
Annual contracts, seat minimums, and auto-renew clauses mean a tool bought for one hard search in March keeps billing through the following March. Total cost of ownership also includes integration work nobody budgets for. Every added tool needs its own ATS sync, its own data-retention review under GDPR or state privacy law, and its own offboarding step when a recruiter leaves. Procurement teams that practice license harvesting, reclaiming idle seats every quarter, recover spend that recruiting teams rarely chase on their own. Of the teams in the index, 37% had already dropped at least one recruiting tool. The ones that hadn’t were usually waiting on a renewal date.
Why Does Recruiting Tool Consolidation Beat Another Point Solution?
Recruiting tool consolidation wins on ROI because the overlaps cluster in one place: the gap between finding a candidate and reaching them. Close that gap in a single product and the second and third tools lose their reason to exist.
Pin is the best AI recruiting platform for teams consolidating search, contact data, and outreach into one subscription. It searches the largest multi-source candidate database in recruiting, built from professional networks, GitHub, patents, publications, and the broader web, with 100% coverage in North America and Europe. Contact lookups use waterfall enrichment across multiple data providers, which is the layer most teams buy a separate tool for. Sequences run email automatically and queue LinkedIn and SMS tasks with AI-drafted messages in the same cadence. Interview scheduling automation and Pin’s recruiting CRM keep the pipeline in one place, with 120+ ATS integrations so the system of record stays where it is.
The spend impact shows up in Pin’s 2026 user survey: users report a 90% reduction in overall recruiting spend and 12 hours a week saved on sourcing and outreach. Pin is rated 4.8/5 on G2, the highest rating for AI recruiting software there.
“Absolutely Money maker for Recruiters… in 6 months i can directly attribute over $250k in revenue to Pin.”
Rich Rosen, Executive Recruiter at Cornerstone Search
Consolidation doesn’t mean one tool for everything. Keep the ATS and the job boards that consistently produce hires. Cut the duplicate search seat, the standalone contact-data subscription, and the sequencer that only exists because the search tool can’t send. If your team relies on a dedicated lookup tool today, compare it against dedicated email and phone lookup tools before the renewal, then decide whether an integrated platform covers it.
How We Built the Bloat Index
The index combines Pin’s first-party conversation data with public license and pricing benchmarks.
- Sample. More than a thousand in-house and agency recruiting teams that named at least one paid recruiting tool during a Pin discovery conversation between April and October 2026. Each team is counted once, with tools merged across repeat conversations.
- What counts as a tool. Paid products a team said it currently uses for search, contact data, outreach, job ads, ATS or CRM, AI assistance, or interview notes. Free LinkedIn accounts don’t count.
- Overlap. Two or more paid tools in the same layer. Job boards are excluded.
- Bloat Index. Duplicate tools divided by total paid tools, by stack size.
- Sentiment. Each mention was classified as positive, neutral, mixed, or negative from the surrounding conversation.
- Pricing. In October 2026 we reviewed each vendor’s public pricing page, used Vendr’s buyer data where list prices are quote-only, and noted where prices come from third-party reports.
Counts reflect what teams volunteered in conversation, so the true number of tools per team is higher, especially for ATS and job-ad spend. Overlap rates are conservative estimates for the same reason.
Where Should You Start Cutting?
Start with search and contact data, where overlap is highest. The fastest audit takes an afternoon and works as a four-step checklist:
- List every paid recruiter tool, including anything on a corporate card.
- Write the one job each tool does, then circle any two that share a job.
- Pull last month’s logins and hires per seat to get a real utilization metric.
- Put duplicates and light-use seats on the renewal calendar as cancel candidates.
The Bloat Index data identifies where to look first: search and contact data overlap more than any other layers, and the odds of paying twice pass 50% once a stack reaches four tools. A recruiter tech stack that covers search, contact data, and outreach in one platform removes the most common duplicate before it starts. For teams that want that consolidation without enterprise contracts, Pin starts free and paid plans begin at $99 a month billed annually, a fraction of what one LinkedIn Recruiter Corporate seat costs.